|
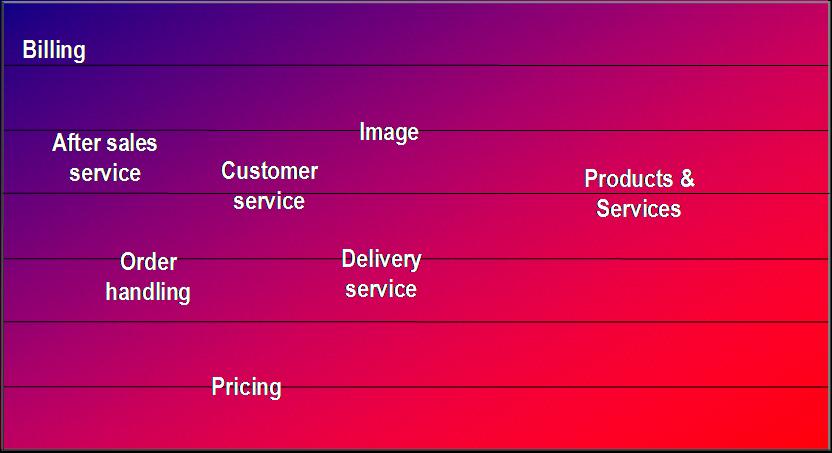
The positioning graph puts scores and impacts for all factors in relation to
each other. This makes it easy to find weak areas where improvements may be
needed and strong areas where low-risk cost savings could be considered.
Positioning graphs may also be available as close-ups when the interaction
between selected factors is of special interest. |